
Subject Experts Solutions for Chapter: Statistics, Exercise 1: Exercise 1
Subject Experts Mathematics Solutions for Exercise - Subject Experts Solutions for Chapter: Statistics, Exercise 1: Exercise 1
Attempt the free practice questions on Chapter 10: Statistics, Exercise 1: Exercise 1 with hints and solutions to strengthen your understanding. Pearson IIT Foundation Mathematics solutions are prepared by Experienced Embibe Experts.
Questions from Subject Experts Solutions for Chapter: Statistics, Exercise 1: Exercise 1 with Hints & Solutions
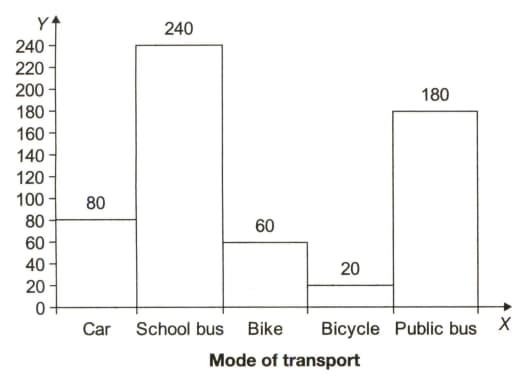
The histogram shows the number of students using different modes of transport to commute from residence to school. From the bar graph, answer the following questions
The ratio of the number of pupils who travel by school bus and who travel by public bus is
A bar graph is drawn to the scale of . The length of the bar representing is . Find the value of .
In a pie-chart, a component is represented as a sector with sector angle , then find the percentage of the value of component totally
A line graph given below shows the number of text messages received by Keerthi during a week. Study the graph carefully and answer the questions that follows
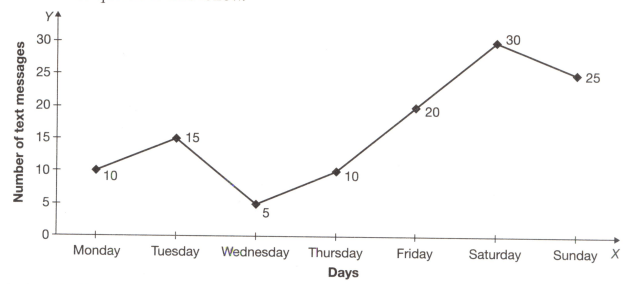
On which day did Keerthi receive the lowest number of text messages?
The line graph shows the attendance of students over a week.
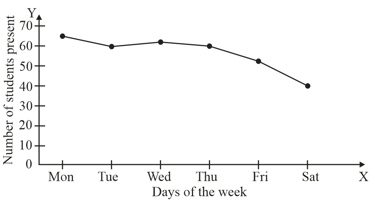
(a) On which day of the week were more number of students present?
The line graph shows the attendance of students over a week.

(b) If boys were present on Thursday, then how many girls were present on the same day?
The given pie chart shows the amount of area in a playground allotted to various sports. Study the pie chart carefully and answer the following questions.
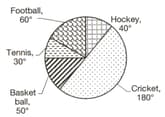
(i) If the area allocated for cricket is , then find the total area of the playground.
The given pie chart shows the amount of area in a playground allotted to various sports. Study the pie chart carefully and answer the following questions.

(ii) Find the area allocated to basket ball in the playground?


